

The Dark Arts is a series of blog posts sharing perspectives and lessons learned on transforming what many may consider technical 'Dark Art' into proper Engineering and Science.
Analyzing Data
In Growing Your Infrastructure Part 1, we talked about various tools which can be used to collect data across your infrastructure. From Zabbix to vSphere , once these tools are in place you can bet you will collect a good amount of data.
What now, though? How do you make any sense of it? What good is a gigabyte of W3SVC logs unless you can find trends, peaks, and valleys?
Let me introduce you to your new best friend, the Elastic Stack!
What is the Elastic Stack?
Well, it is a stack because it's comprised of three separate components: Elastic, Logstash, and Kibana. Each of these components work together to collect, index, and present all sorts of data you send it. You can send log files in any format to ELK, even database records, and ELK will happily ingest those files and index them. Once you're ready to search for them, Kibana gives you a beautiful web-based interface to do your searching and analysis.
So how do you plan for something like that? Of course, a big part of the answer to that depends on your software architecture and whether it supports horizontal scaling, vertical scaling, or both. What we've learned in the past is to plan for what the customer expects in terms of usage, but prepare to scale for magnitudes of usage beyond that.
Let's take a brief look at each of these components in Elastic.
Kibana
Kibana is the web interface overlaying the data you are collecting. As the data is sent to logstash and ingested by elastic search, you need some way to query and visualize the data. That's where Kibana comes into play.
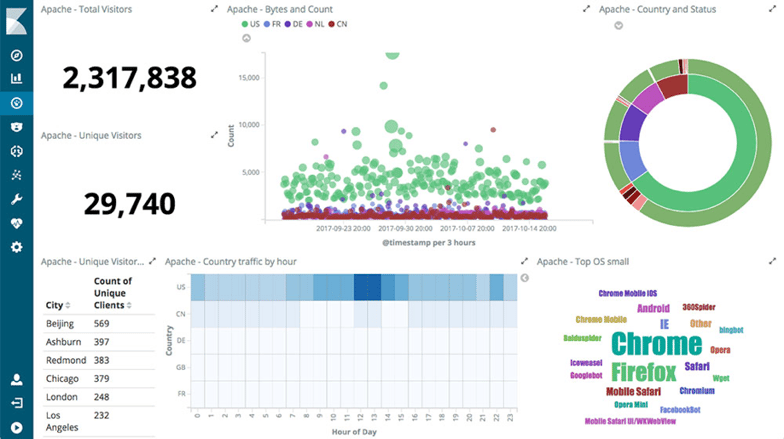
As you can see from the image above, Kibana has a rich interface allowing you to put all sorts of metrics and queries together.
One thing that’s really cool about Kibana is that when you put a dashboard like the one illustrated together, it updates in real time. Perfect for putting up on a monitor in the office to watch your storefront's activity!
You can host Kibana on a server in your datacenter, just like the other components of the stack, or use a cloud-based hosting service.
Read more about Kibana here.
Elastic Search
Elastic Search is the workhorse in the stack. It receives logs in all sorts of formats from logstash and ingests the data. Once ingested, it attempts to index the data so that you can quickly search for it (in Kibana or even via APIs).
Elastic can handle petabytes of data and powers the search and analytics for companies such as Netflix, LinkedIn, and StackOverflow.
As mentioned, Elastic can ingest all sorts of data formats. Not simply text; it can ingest and understand geo and numeric data structures along with virtually any other unstructured data type.
You can read more about Elastic Search here.
Logstash
Logstash is what collects and sends all of your data into the rest of the stack. Without it, Elastic would never have data to index and Kibana would never have anything useful to show you! Logstash's strengh lies in its ability to quickly collect, parse, and transform your log files (or any data really, even database records) and get them into Elastic for indexing.
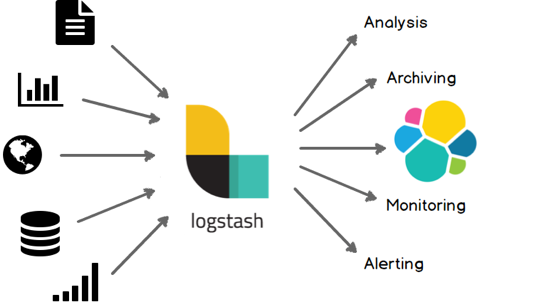
For more on Logstash, take a look here
In addition to Logstash, Elastic offers Beats. Beats are individual log shippers developed for shipping specific types of data. For instance, there is a File Beat for log files, a WinEvent Beat designed for extracting Windows event logs, a Packet Beat for network shipping, and more.
Beats work in conjunction with Logstash to collect and ship your data into Elastic Search.
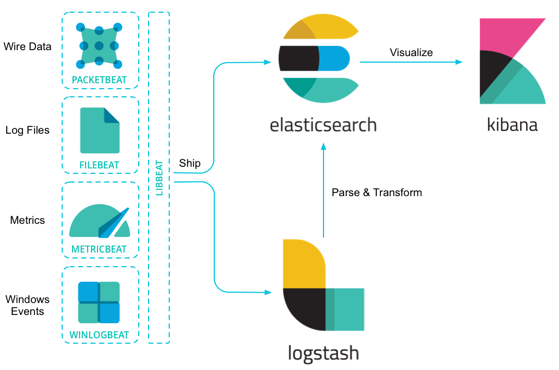
For more on Beats, take a look here.
Hosting Elastic Search
Now that you have a basic understanding of what's in the Elastic Stack, it's time to consider how to host your stack. This really depends on your setup and infrastructure capabilities, but if you're generating less than a few gigabytes of logs per day you can easily install the Elastic Stack onto a single machine.
If your deployments and other processes (such as cron jobs, feeds, etc.) generate more than a few 10s of gigabytes, or you're hosting deployments where data must be isolated, you will want to install Elastic across several dedicated machines.
However, one approach if you're simply concerned with separation of data would be to set up a single server and use Docker containers for multiple Elastic instances. You'll then use Logstash and Beats to forward logs from each deployment individually into its respective Elastic install (container).
Also, when considering your server(s), we have found that hosting Elastic on a Linux server provides the best in performance and stability. Linux uses resources more efficiently than a typical Windows Server configuration.
Alternatively, you may want to consider using Elastic's cloud service for hosting Elastic. This gives you the opportunity to simply focus on the data rather than also managing the installation, configuration, and on-going management of a busy Elastic Stack.
You can read more about Elastic Cloud and Elastic's Hosted options here.
In Part 3 of our series, we will talk about how to integrate this data into your support and operations teams for issue escalation, notification, and resolution.
Strengthen Your Tech Stack with a Distributed Marketing Platform
There is a way to empower your teams in the field to conduct better local marketing while maintaining your brand at a corporate level and reducing tech stack-related IT headaches. Discover how the right distributed marketing platform can integrate seamlessly in your existing infrastructure (or even simplify it by reducing redundant functions!)—get The Ultimate Guide to Distributed Marketing now:
